Education Snapshot
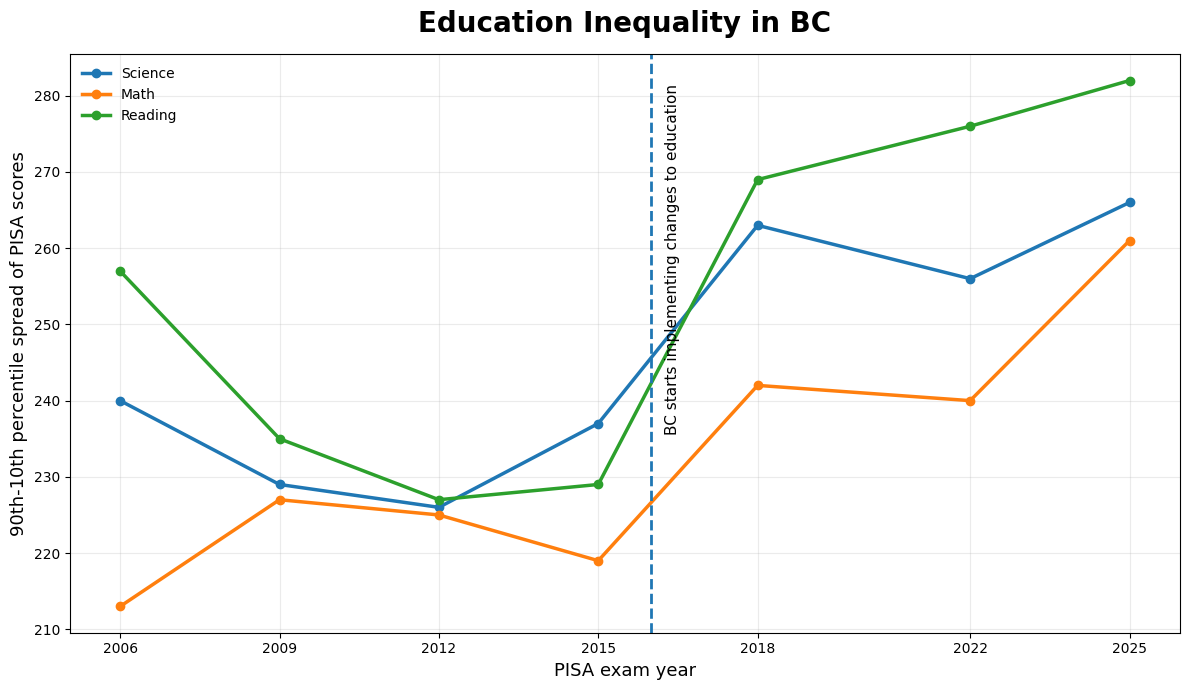
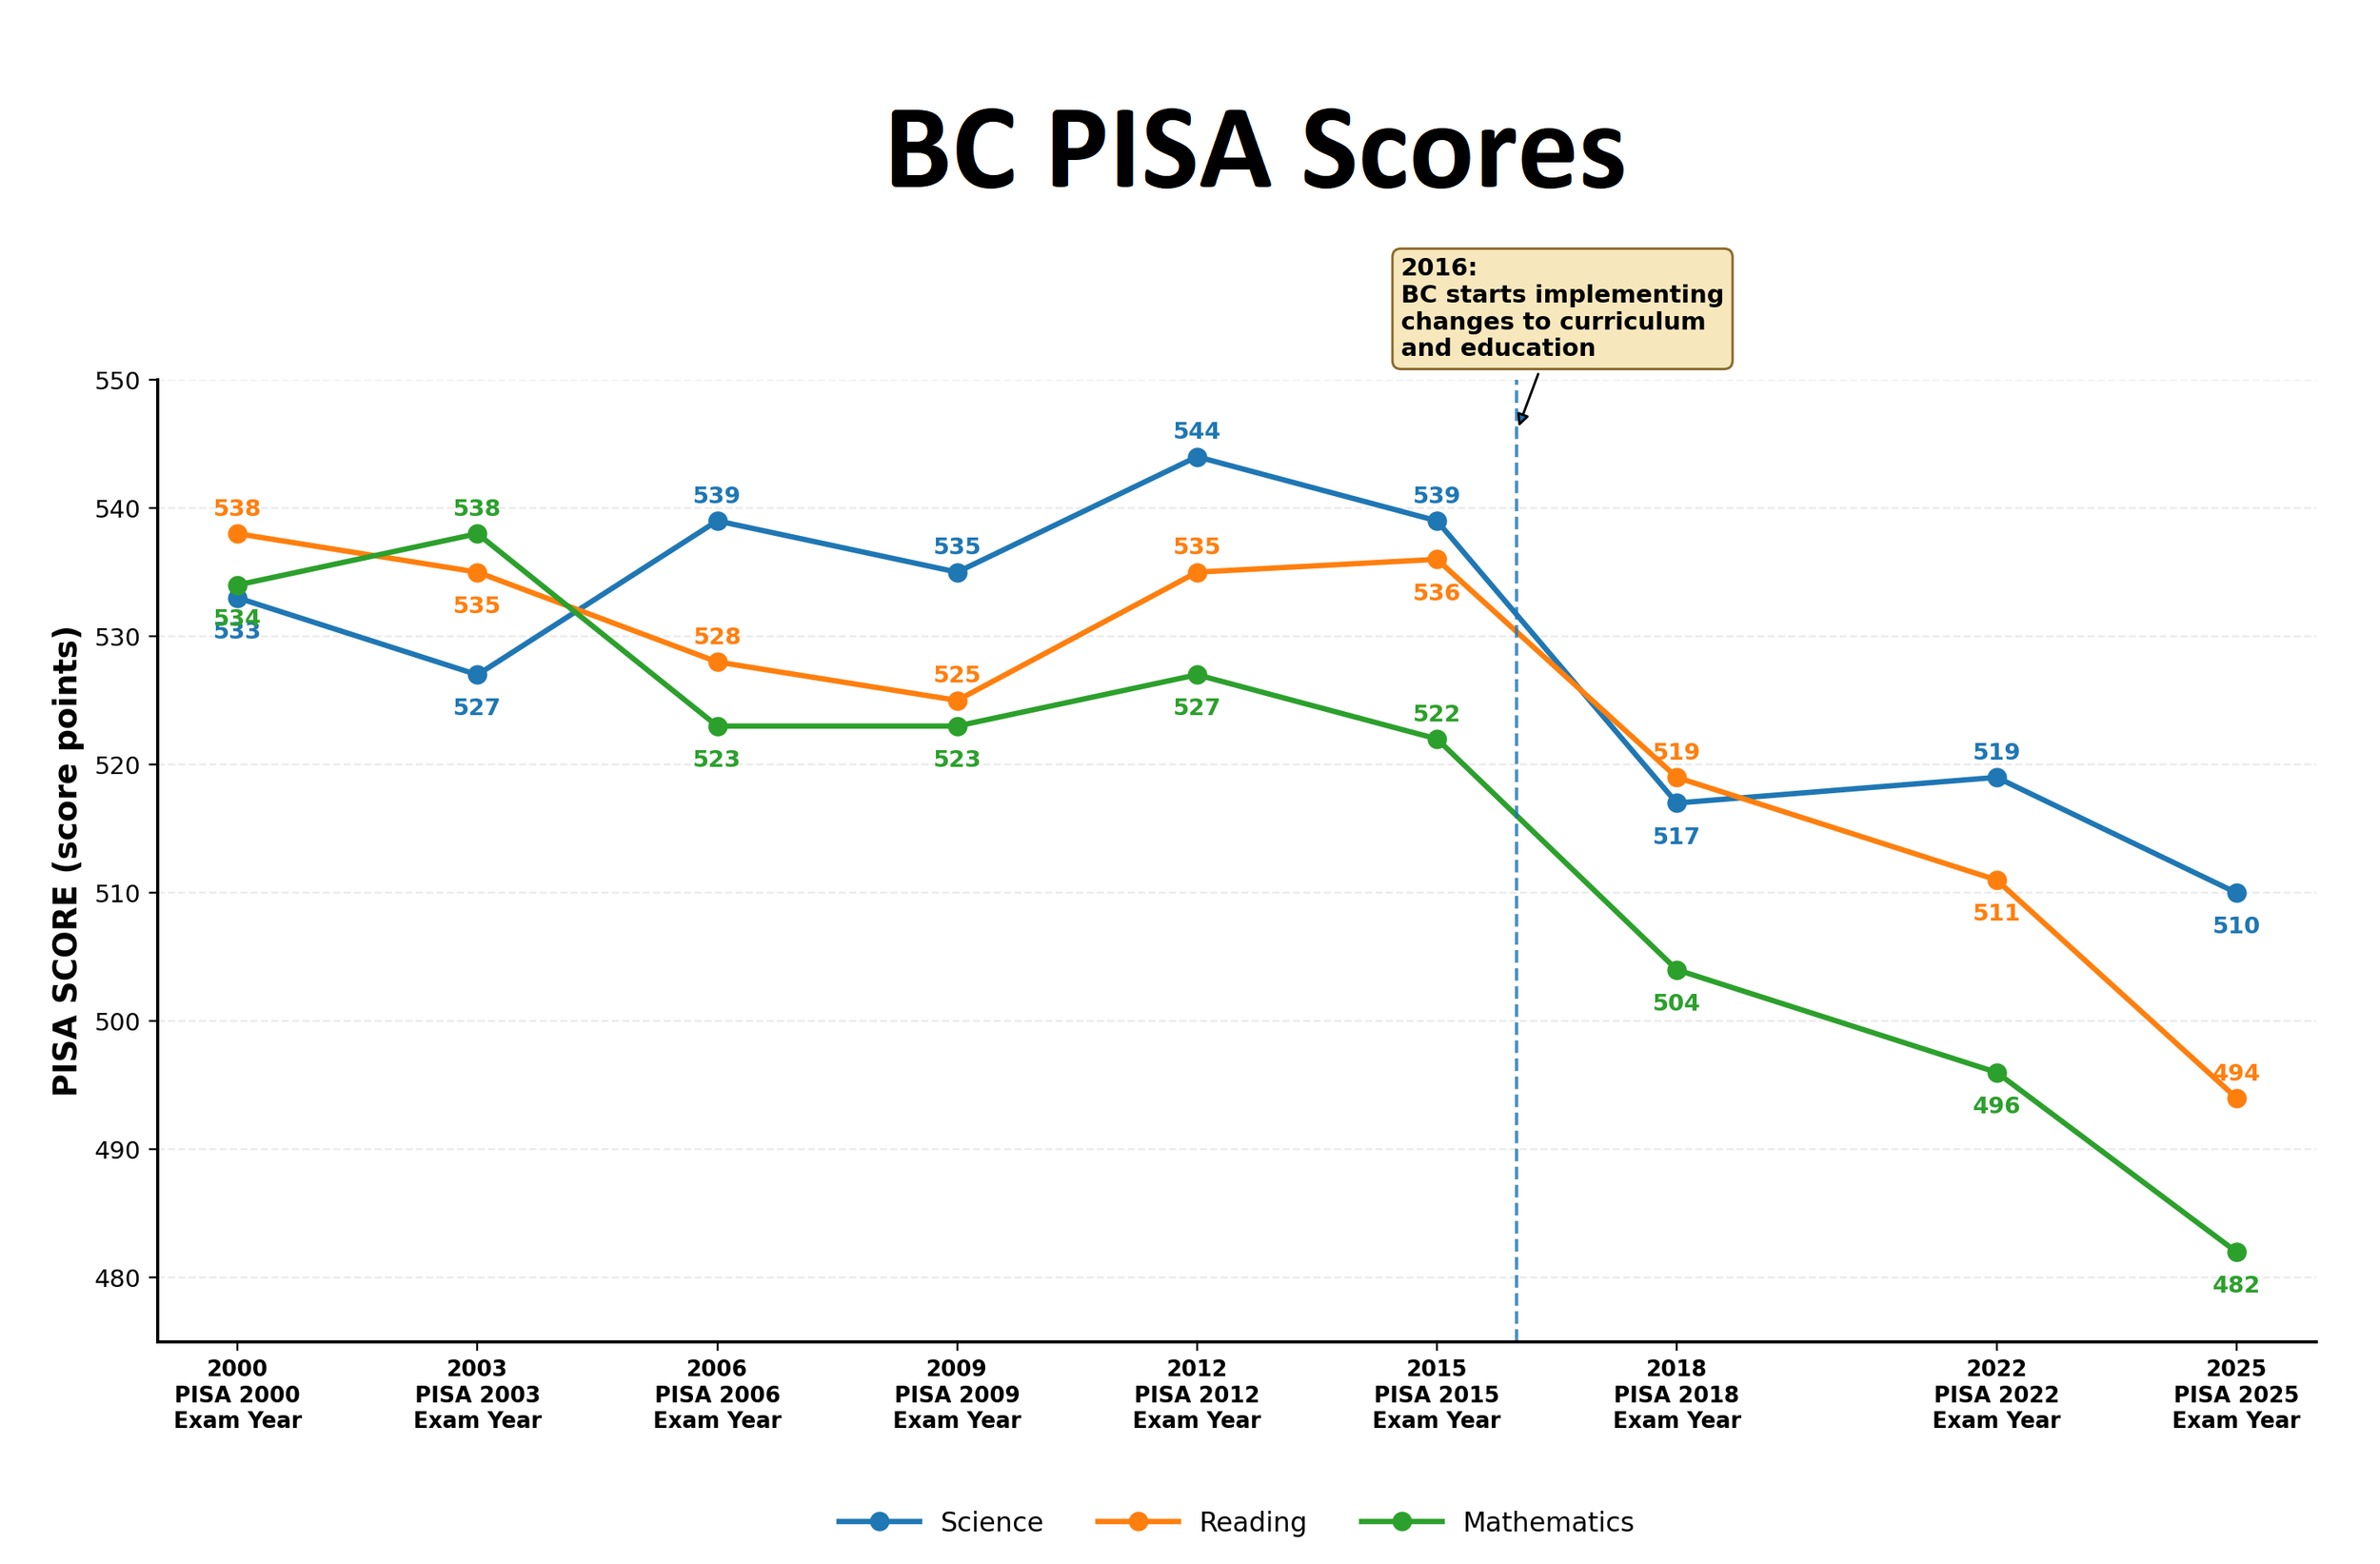
The story of BC education in two graphs. I will try to keep this one brief.
There has been a precipitous drop in math, reading and science since BC started implementing changes to its curriculum and education in 2016. What’s even worse is that at the same time education inequality has increased; the difference between the top and bottom students keeps increasing while learning suffers.
Academic scores are a small measure of what a meaningful education entails. No one is more cognizant of that than me. What this objective measure represents is far more consequential. We have a brief window in their most formative years to leave them with improved critical thinking ability, work ethic, aptitude and capacity for judgement among other tools not only to better their own lives but make meaningful contributions to our society. The scores represent lost opportunities. The scores represent the ignored potentials of our students in SD73.
*The PISA exams are one of the last standardized exams we have in BC. I have posted about them in more detail if you want to check it out.
*The results are worse than they seem unfortunately. The participation rate in BC is quite poor. In fact, the only reason why the results are considered valid is because it gets pooled in with the rest of Canadian results. The weighted student participation is around 71%. The students not participating are likely to score lower. What does that mean? There is an upward bias in the scores. Education inequality is especially worse than it seems.
*Canada has seen a drop in PISA scores generally. Nowhere is that worse than in BC. No province has changed its educational system as much as BC.